Visualize Your Data
Install Guide
0. Install the Google Chrome extension 'ChatGPT Plugin Store Searchable', or use the Tampermonkey script with the same name.
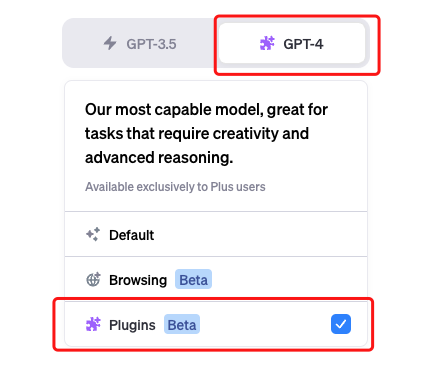
1. Open ChatGPT, select the GPT-4 model, and choose the Plugins mode.

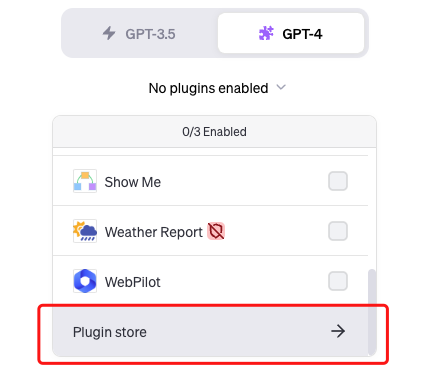
2. Click the dropdown arrow to open the installed plugins list, scroll down to the bottom and click on 'Plugin Store'.

3. Open the ChatGPT Plugin Store, enter 'Visualize Your Data', click on search, and find 'Visualize Your Data' in the plugin list.
4. Click the 'Install' button to install 'Visualize Your Data'.
Usage
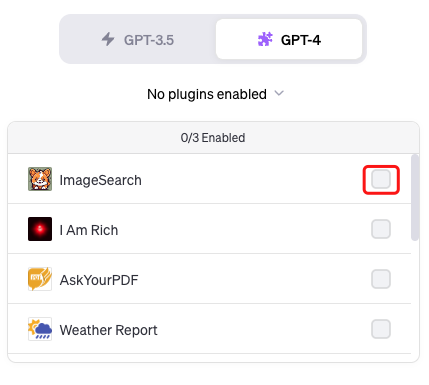
5. Click the dropdown arrow to open the installed plugins list, find 'Visualize Your Data', and choose it to enable.

6. The image below shows the interface display effect after a certain plugin has been enabled.

7. Enter 'How to use this plugin?' in the chat input box.
Use the 'Visualize Your Data' plugin according to the usage instructions returned by ChatGPT.


